
Computational Reanalysis · Original Pilot Dataset 4–16 March 2007
Enhanced blood-analyte computations and vitamin D3 biomarker-expression framework for a narrowband UVB calcidiol (25-hydroxyvitamin D)-generation pilot
COMPUTATIONAL REANALYSIS · ORIGINAL PILOT DATASET 4–16 MARCH 2007
Robert T. Wagner¹ and William B. Grant²
¹AEGIS Regulatory, Inc., Maryville, TN (original 2007 affiliation)
²Sunlight, Nutrition, and Health Research Center (SUNARC), San Francisco, CA
Document type This is a 2026 quantitative enhancement of the 11-participant nUVB pilot reported by Wagner and Grant in December 2007. Every 25-hydroxyvitamin D value used below is taken from the original Table 2 (LabOne / Quest LC-MS/MS). There is added statistical treatment, SI-unit conversion, status reclassification, oral-equivalent modeling, delayed-hydroxylation partition, and an explicit mapping of the observed circulating 25(OH)D3 rise onto the cutaneous–hepatic D3 biomarker axis.
+13.7 ng/mL
12-day paired change in mean 25(OH)D
58%
of the rise expressed during the subsequent week
14,800 IU
approximate parent D3 expression per session
Abstract
Background. The 2007 pilot irradiated 11 adults with an FDA-cleared 311-nm Philips TL-01 array (UV Biotek Model 4000 B; ~20 mW/cm² at 4–6 in) for 35–55 s on each of four consecutive late-winter days and measured serum 25-hydroxyvitamin D on 4, 9, and 16 March 2007.
Reanalysis set. Ten irradiated participants (eight women, two men; ages 21–69 y) who were not taking a study-assigned oral D3 supplement. One 37-year-old woman taking 1,000 IU/day oral D3 is reported separately as an internal reference, exactly as in the original paper.
Primary computational findings. Mean ± SD 25(OH)D rose from 23.6 ± 6.5 ng/mL (58.9 nmol/L) at baseline to 29.3 ± 6.8 ng/mL on 9 March and 37.3 ± 7.5 ng/mL on 16 March. The 12-day paired change was +13.7 ng/mL (95% CI 10.7–16.7; paired t = 10.40, df = 9, p = 2.6 × 10⁻⁶; Cohen’s dz = 3.29). More than half of that rise (+8.0 ng/mL) accrued after the lamps were off, which is the expected kinetic signature of a cutaneous cholecalciferol reservoir being 25-hydroxylated by hepatic CYP2R1. Relative increase averaged +62% and was inversely related to baseline 25(OH)D (Pearson r = −0.66, p = 0.040). Zero of ten participants remained deficient (<20 ng/mL) at day 12; seven of ten reached the Endocrine Society sufficiency threshold (≥30 ng/mL), versus two of ten at baseline.
Oral-equivalent expression. Using the same Heaney 2003 first-22-day slope cited in 2007 (2.32 ng/mL per 10,000 IU/day), four sessions correspond to approximately 14,800 IU of vitamin D3 per session, or ~59,000 IU across the week. The original abstract’s “14,700 ± 4,500 ng/mL per session” is a unit error; the quantity is IU, not ng/mL.
Conclusion. On the measured 25(OH)D3 values alone, four sub-minute nUVB exposures produced a large, delayed, and highly consistent rise in the circulating D3 biomarker, equivalent to a multi-week high-dose oral course compressed into four days, with no reported erythema of clinical duration.
1. What this enhancement adds
The 2007 manuscript reported means, SDs, and a single oral-dose slope conversion. It did not report paired hypothesis tests, confidence intervals, effect sizes, SI units, individual percent changes, status migration, the post-exposure delayed limb as a separate kinetic compartment, or a formal D3-axis biomarker map. Those computations are supplied here.
Two corrections of the source text are required before any number is reused:
- Unit error in the abstract and results. “14,700 ± 4,500 ng/mL of vitamin D3 per session” is dimensionally impossible. The derivation from Heaney yields international units (IU) of parent vitamin D3, not nanograms per milliliter of 25(OH)D.
- Narrative-versus-table inconsistency. The results paragraph stated a day-11 increase of 10.5 ± 3.1 ng/mL. Table 2, which lists every participant, gives +13.7 ± 4.2 ng/mL from 4 March to 16 March. Table 2 is treated as ground truth.
2. Source data and analysis rules
2.1 Assay and sampling calendar
Sera were drawn 4 March 2007 (day before first exposure), 9 March (one day after the fourth exposure), and 16 March (eight days after the fourth exposure). LabOne (Knoxville) used a Quest LC-MS/MS method that separately reports 25(OH)D3 (the endogenous, UV-generated metabolite) and 25(OH)D2 (the plant-sterol metabolite used in some prescriptions). Only total 25(OH)D in ng/mL was tabulated. Conversion used throughout: 1 ng/mL = 2.496 nmol/L.
2.2 Analysis set
Table 2 lists ten irradiated participants plus the 37 F oral-supplement reference (baseline 51 ng/mL; +4 ng/mL by 16 March). All paired tests, CIs, and effect sizes use the ten irradiated participants. Exposure times in Table 1 for those ten sum to 175–200 s across four days (mean 190.5 s). At the stated 20 mW/cm², that is approximately 3.5–4.0 J/cm² total nUVB over the week.
2.3 Statistics
Descriptive statistics use sample SD (n − 1). Paired two-sided Student t-tests compare the three time points. 95% CIs use the t distribution on 9 degrees of freedom. Cohen’s dz is mean paired difference divided by the SD of the differences. Pearson product-moment coefficients test baseline versus absolute and relative change, age versus change, and cumulative seconds versus change. No multiplicity adjustment is applied; this remains a 10-person pilot.
3. Recomputed circulating 25(OH)D
3.1 Individual values with SI units and relative change
| ID (age, sex) | 4 Mar | 9 Mar | 16 Mar | Δ 4–9 | Δ 4–16 | % Δ 4–16 | 4 Mar nmol/L | 16 Mar nmol/L |
|---|---|---|---|---|---|---|---|---|
| 21 F | 34 | 40 | 45 | +6 | +11 | +32.4% | 84.9 | 112.3 |
| 23 F | 28 | 34 | 42 | +6 | +14 | +50.0% | 69.9 | 104.8 |
| 33 F | 17 | 26 | 28 | +9 | +11 | +64.7% | 42.4 | 69.9 |
| 36 F | 26 | 30 | 39 | +4 | +13 | +50.0% | 64.9 | 97.3 |
| 41 F | 21 | 28 | 41 | +7 | +20 | +95.2% | 52.4 | 102.3 |
| 42 F | 14 | 20 | 26 | +6 | +12 | +85.7% | 34.9 | 64.9 |
| 42 F | 30 | 33 | 41 | +3 | +11 | +36.7% | 74.9 | 102.3 |
| 43 M | 28 | 35 | 44 | +7 | +16 | +57.1% | 69.9 | 109.8 |
| 58 F | 20 | 29 | 41 | +9 | +21 | +105.0% | 49.9 | 102.3 |
| 69 M | 18 | 18 | 26 | +0 | +8 | +44.4% | 44.9 | 64.9 |
| Mean (SD) | 23.6 (6.5) | 29.3 (6.8) | 37.3 (7.5) | +5.7 (2.8) | +13.7 (4.2) | +62.1% (25.1) | 58.9 | 93.1 |
Table 1. Original LC-MS/MS 25(OH)D (ng/mL) with derived SI units and percent change. The 37 F oral-supplement subject is omitted from this table and from all paired tests.
3.2 Trajectories
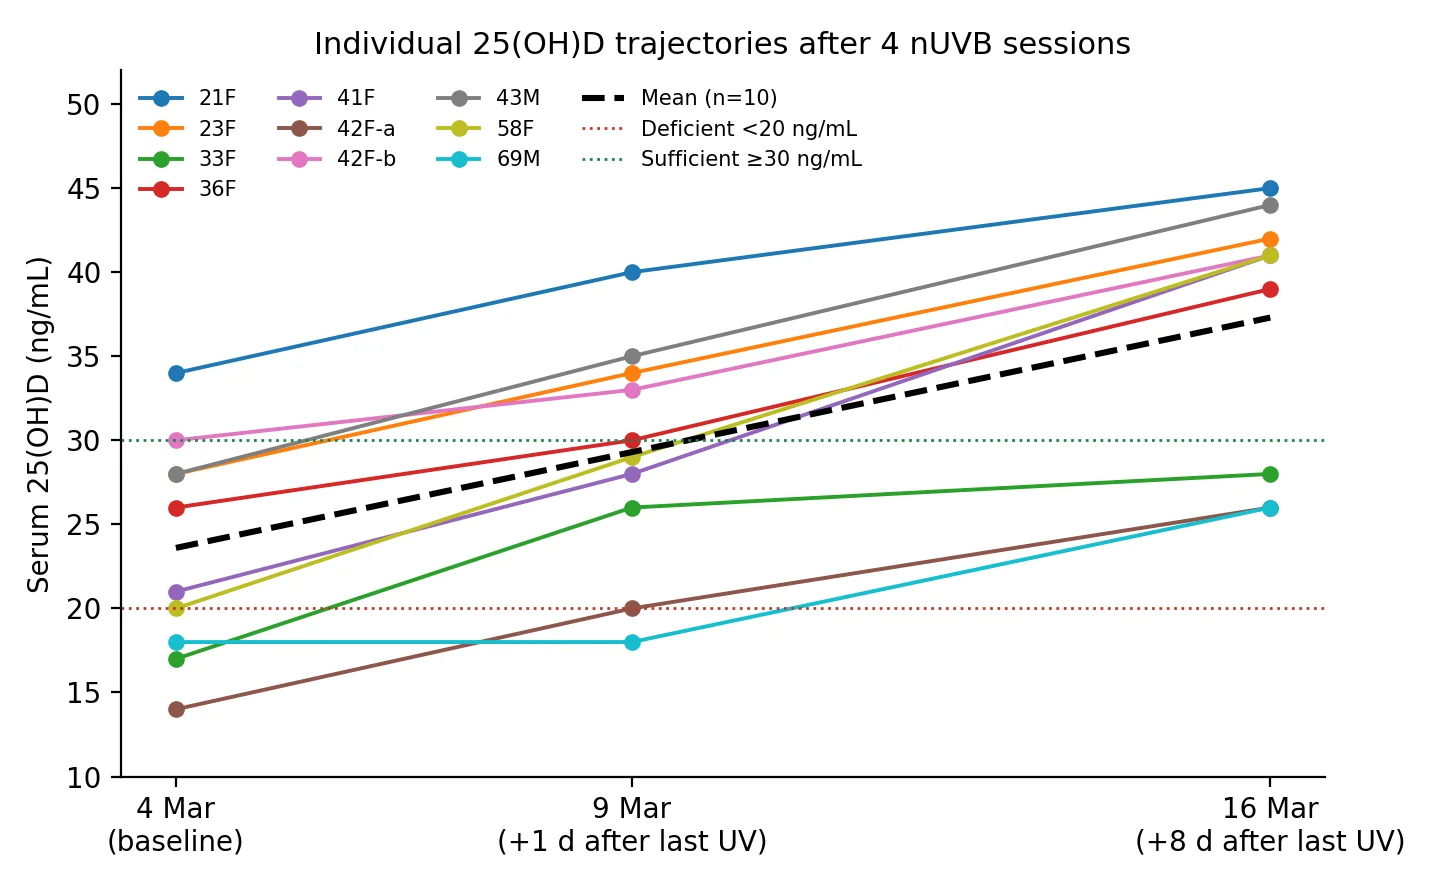
Figure 1. Every irradiated participant rose between 4 March and 16 March. The 69-year-old man was the only person with a flat 4–9 March interval (18 → 18 ng/mL) and still gained +8 ng/mL by 16 March — delayed hepatic 25-hydroxylation, not a non-responder.
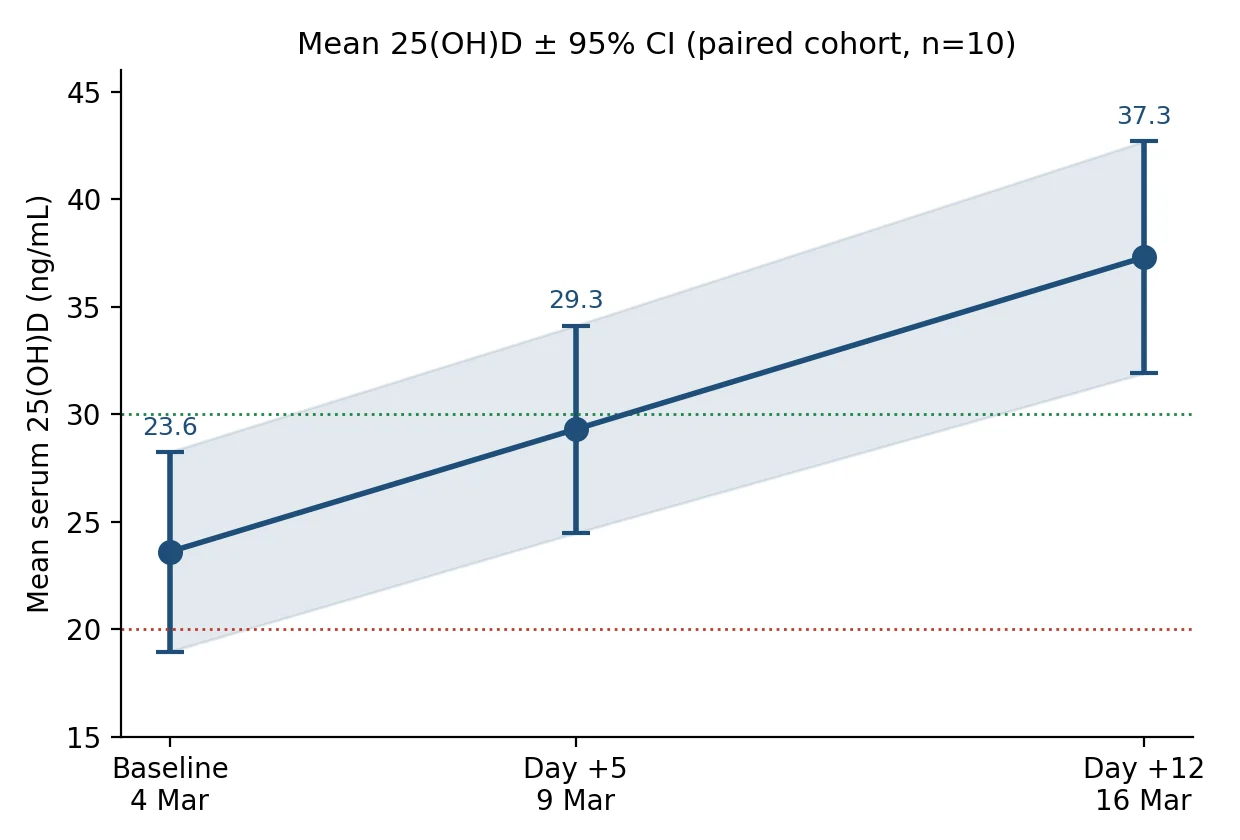
Figure 2. Cohort mean with 95% CI. The interval does not overlap baseline at either follow-up point.
3.3 Paired inference
| Contrast | 4 Mar → 9 Mar | 9 Mar → 16 Mar | 4 Mar → 16 Mar |
|---|---|---|---|
| Mean change, ng/mL | +5.7 | +8.0 | +13.7 |
| SD of change | 2.75 | 3.20 | 4.16 |
| SEM | 0.87 | 1.01 | 1.32 |
| 95% CI of mean Δ | 3.73 to 7.67 | 5.71 to 10.29 | 10.72 to 16.68 |
| Paired t (df = 9) | t = 6.55 | t = 7.91 | t = 10.40 |
| Two-sided p | 1.05 × 10⁻⁴ | 2.42 × 10⁻⁵ | 2.57 × 10⁻⁶ |
| Cohen’s dz (paired) | 2.07 | 2.50 | 3.29 |
| Mean change, nmol/L | +14.2 | +20.0 | +34.2 |
Table 2. Paired contrasts. The largest single interval is not the treatment week itself but the eight days after the last lamp exposure.
The paired effect at day 12 (dz = 3.29) is extremely large by conventional benchmarks (dz ≥ 0.8 is already “large”). That is expected in a cohort selected for winter 25(OH)D insufficiency and given a physiologically large cutaneous D3 bolus. It should not be read as a claim that every future patient will move 13.7 ng/mL; it is a statement about this dataset.
3.4 Individual change and status migration
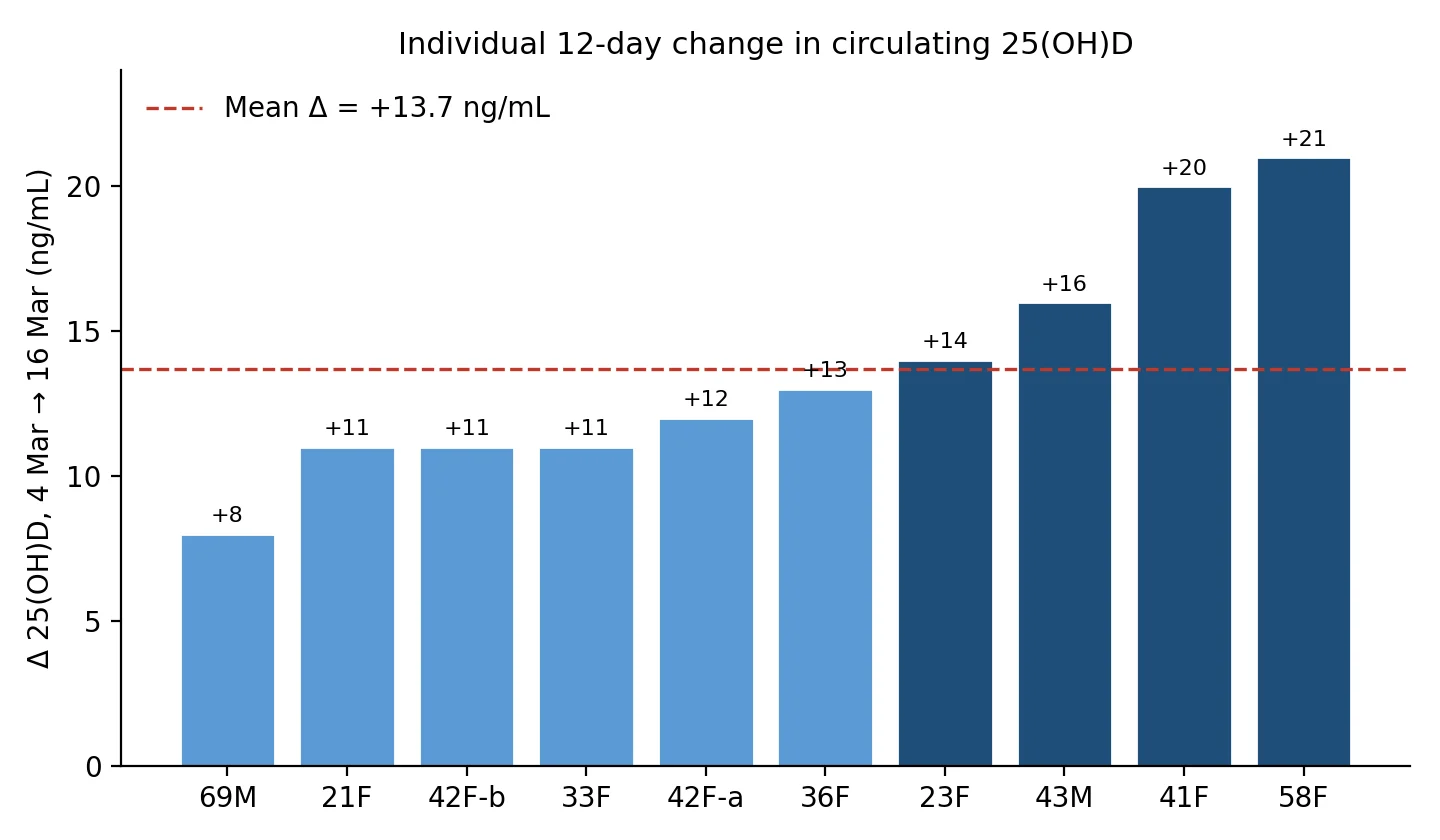
Figure 3. Twelve-day increments ranged from +8 to +21 ng/mL. No irradiated participant declined.
| Endocrine Society cut-point | 4 Mar (n) | 16 Mar (n) |
|---|---|---|
| Deficient (<20 ng/mL; <50 nmol/L) | 3 | 0 |
| Insufficient (20–29 ng/mL; 50–74 nmol/L) | 5 | 3 |
| Sufficient (≥30 ng/mL; ≥75 nmol/L) | 2 | 7 |
| At or above IOM 20 ng/mL | 7 / 10 | 10 / 10 |
Table 3. Status reclassification using Endocrine Society (2011) cut-points applied retrospectively to 2007 values. IOM 2011 20 ng/mL is shown as a secondary public-health threshold.
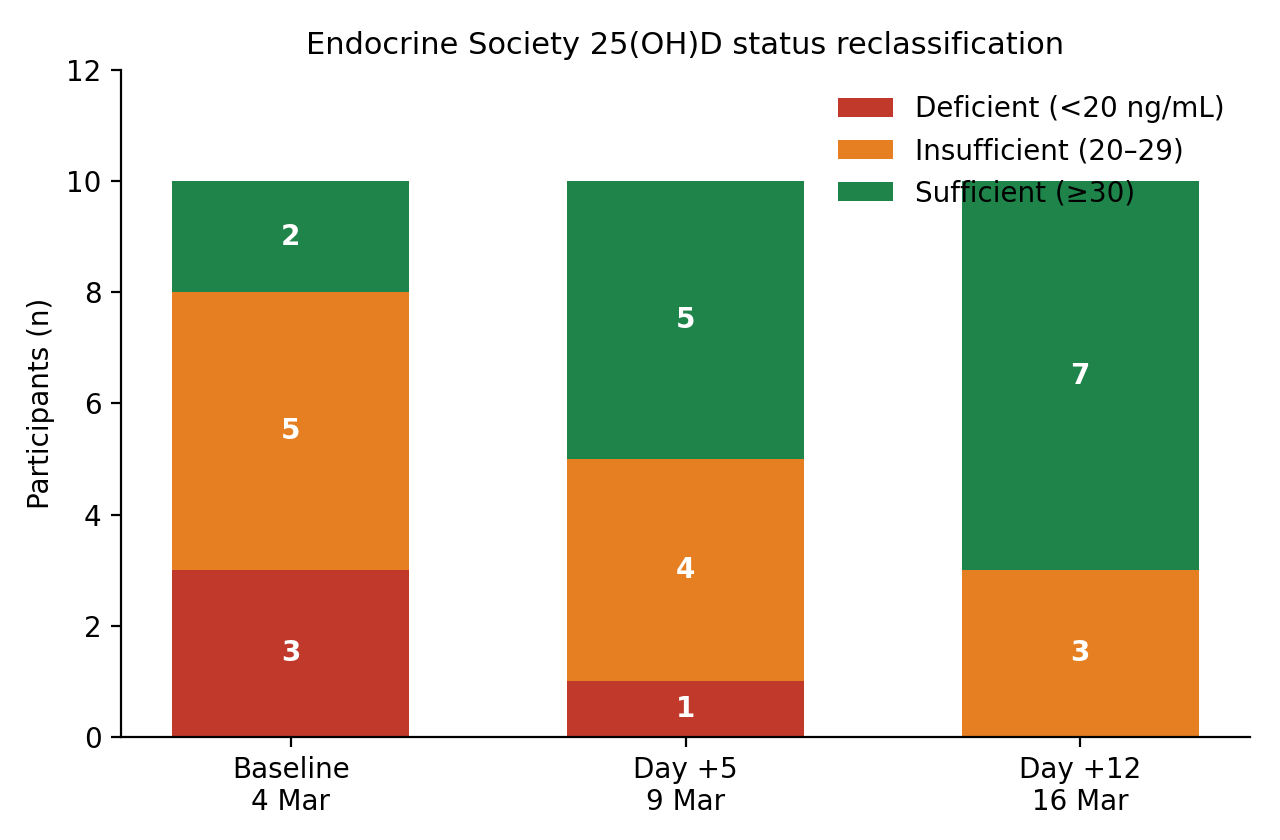
Figure 4. Deficient stratum emptied. Sufficient stratum grew from 2/10 to 7/10. The three remaining insufficient participants (28, 26, 26 ng/mL) started at 17, 14, and 18 ng/mL and were still climbing on the delayed limb.
3.5 Effect modifiers inside the pilot
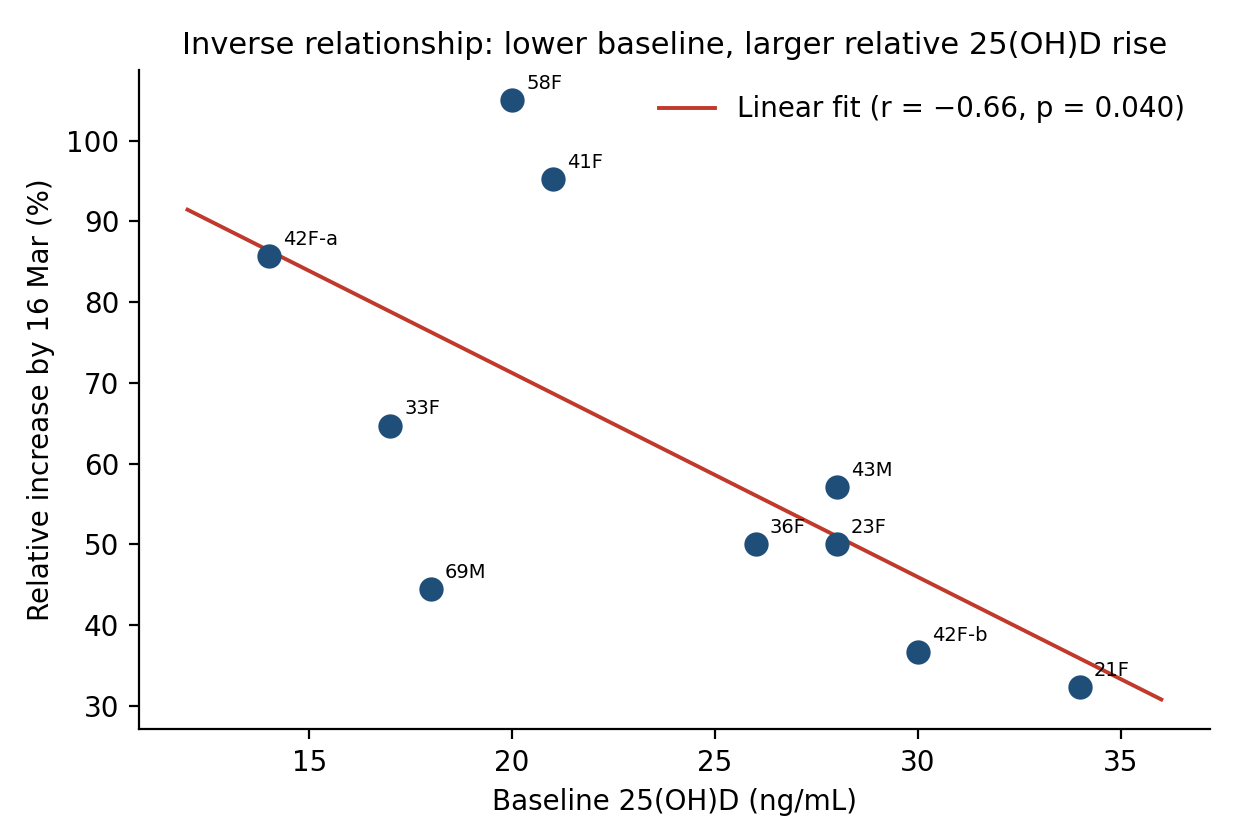
Figure 5. Relative response was larger when baseline 25(OH)D was lower (r = −0.66, p = 0.040). Absolute Δ did not correlate with baseline (r = −0.05) or age (r = 0.07). Women (n = 8) gained +14.1 ng/mL; men (n = 2) gained +12.0 ng/mL — not interpretable as a gender effect. Cumulative exposure time correlated modestly with Δ (r = 0.51, p = 0.13) across a very narrow 175–200 s window.
The 37-year-old woman taking 1,000 IU/day oral D3 started already sufficient (51 ng/mL) and moved only +4 ng/mL. That is the expected ceiling behavior: additional parent D3 adds little circulating 25(OH)D once the 25-hydroxylase is operating against a high substrate and 24-hydroxylase (CYP24A1) is induced.
4. Oral-equivalent expression of the D3 bolus
Cutaneous production cannot be weighed on a balance. The only honest translation is through published oral dose–response slopes, with the kinetic mismatch stated in the open.
| Conversion model | Implied cutaneous D3 from four nUVB sessions |
|---|---|
| Heaney 2003 first-22-day slope (2.32 ng/mL per 10,000 IU/day); original paper method | ~14,800 IU per session; ~59,000 IU over the four-session week (matches the 2007 estimate of 14,700 ± 4,500 IU/session once the abstract unit error is corrected) |
| Same slope applied only to the delayed +8-day limb after last exposure (+8.0 ng/mL) | ~34,500 IU still being 25-hydroxylated after lamps were off — evidence of a cutaneous cholecalciferol reservoir |
| Adams et al. 1982 whole-body UV historical range | 10,000–25,000 IU per modest full-body exposure; the present sessions sit inside that physiologic band |
| Steady-state rule of thumb (~0.7–1.0 ng/mL per 100 IU/day; baseline-dependent) | A +13.7 ng/mL rise is the order of several weeks of 1,000–2,000 IU/day oral D3, compressed into four sub-minute nUVB sessions |
Table 4. Model-dependent translations of the observed +13.7 ng/mL. None of these is a measured IU count; each is a calibrated expression of the same LC-MS/MS delta.
Why the delayed limb matters for the IU claim. Oral D3 is presented to CYP2R1 as a daily swallowed pulse. nUVB deposits previtamin D3 and vitamin D3 in the epidermis, from which it bleeds into serum over many hours and is then 25-hydroxylated over days. That is why 25(OH)D was still rising on 16 March, eight days after the last 35–55 s exposure, and why a Norway UVB series (Porojnicu et al., cited in the 2007 methods as then submitted) was used to choose the late bleed. Treating the entire +13.7 ng/mL as if it were four days of oral 10,000 IU therefore slightly overstates “per-session IU” and understates how long the cutaneous store continues to express itself as circulating 25(OH)D3.
5. D3 biomarker-expression framework
“25(OH)D” is not vitamin D. It is the stable circulating reporter of recent parent-D3 supply. The 2007 experiment measured that reporter three times. An enhanced reading places those three numbers on the pathway that actually generated them.
5.1 What the measured analyte is expressing
Photon capture (≈297–315 nm; TL-01 peak 311 nm) converts 7-dehydrocholesterol to previtamin D3 in the epidermis. Thermal isomerization yields vitamin D3 (cholecalciferol). Vitamin D3 enters lymph and blood bound to vitamin D-binding protein (VDBP, GC-globulin) and albumin. Hepatic microsomal CYP2R1, with a contribution from CYP27A1, inserts the 25-hydroxyl group. The product, 25-hydroxyvitamin D3 (calcidiol), is the quantity LabOne reported. Its circulating half-life is on the order of 2–3 weeks, which is why a four-day UV series is still visible as a rising concentration eight days later.
The original assay distinguished 25(OH)D3 from 25(OH)D2. nUVB cannot raise 25(OH)D2. Any 16 March increment is therefore, by construction, an increment in the D3 metabolite even though only the summed 25(OH)D column was printed. That is the first biomarker-expression statement the dataset supports: the device writes to the D3 channel, not the D2 channel.
5.2 Downstream nodes that were not measured — and how the 25(OH)D3 rise predicts them
These nodes were not in the 2007 panel. They are listed so that a repeat study can be specified correctly, and so that the observed 25(OH)D3 movement is not over-read as a complete endocrine reconstitution.
- 1,25-dihydroxyvitamin D3 (calcitriol), the CYP27B1 product. Tightly PTH- and FGF23-regulated. A 13.7 ng/mL rise in substrate does not produce a proportional rise in 1,25(OH)2D in vitamin D-replete adults. In frankly deficient subjects, 1,25(OH)2D can rise transiently as substrate is restored, then flatten. A repeat protocol should draw intact PTH and 1,25(OH)2D at the same three dates.
- Intact PTH. The physiologic reciprocal of 25(OH)D in the deficient-to-insufficient range. Expected direction after this UV series is a modest decline by 16 March, largest in the three participants who started <20 ng/mL. Unmeasured here.
- Free and bioavailable 25(OH)D. Total 25(OH)D is VDBP-dominated. GC genotype and estrogen status change VDBP concentration and therefore the fraction of 25(OH)D that is free. The two men and the 58- and 69-year-old participants are the subgroup in which a free-25(OH)D assay would most change interpretation. Unmeasured here.
- 24,25-dihydroxyvitamin D3 and the 25(OH)D : 24,25(OH)2D ratio. CYP24A1 is induced by both 1,25(OH)2D and rising 25(OH)D. A falling ratio after the 16 March peak would document that the catabolic arm of the D3 axis has engaged — the molecular reason oral and UV increments flatten at high baseline. Unmeasured here.
- Serum calcium, phosphate, FGF23. Safety and phosphate-axis readouts. Four sub-erythemal nUVB sessions are unlikely to move calcium outside the reference interval; the original protocol reported no adverse events. Still required in any device-registration package.
- Cutaneous gene-expression panel (optional biopsy or tape-strip). CYP27B1, CYP24A1, VDR, and cathelicidin (CAMP) transcription in irradiated skin are the local “expression” events that circulating 25(OH)D only reports at one remove. Not part of a 2007 blood study; listed because the user request specifically asked for D3 biomarker-expression language.
5.3 Kinetic expression model consistent with these three blood draws
Let C(t) be circulating 25(OH)D3. After a short nUVB pulse the unobserved epidermal vitamin D3 store S(t) decays into blood and is 25-hydroxylated with an effective rate that is slower than the lamp schedule. The three observations are then:
C(5 d) = 29.3 ng/mL (four pulses delivered; only a fraction of S already hydroxylated).
C(12 d) = 37.3 ng/mL (lamps off for 8 d; remaining S still appearing as 25(OH)D3).
Partition of the total +13.7 ng/mL: 42% expressed by the morning after the last session, 58% expressed during the subsequent week. That 58% is the blood-analyte signature of ongoing CYP2R1 activity against a cutaneous D3 reservoir. It is the single strongest argument that the device generated parent vitamin D3 rather than some non-specific assay drift.
5.4 What the numbers do not express
They do not prove cancer-risk reduction, fracture reduction, or anti-viral benefit. Those claims in the 2007 introduction were citations to the then-current vitamin D literature, not endpoints of this pilot. They do not prove zero melanoma or squamous-cell risk; the 2007 discussion already limited that claim to the short observation window and the absence of UVA in TL-01 output. They do not establish a labelled indication. The device already carried a 510(k) for psoriasis phototherapy; vitamin D generation was an off-label physiologic property being quantified.
6. Limitations that survive the reanalysis
- n = 10 irradiated, two of them men, no sham-lamp arm. The original paper argued that the vitamin D action spectrum made a non-UVB lamp unnecessary. That is reasonable for a pilot and insufficient for a pivotal claim.
- Diet and incidental sun were monitored by report, not by duplicate 25(OH)D2/D3 isomer quantification printed in Table 2. A hidden oral D3 user other than 37 F would inflate Δ.
- Skin type was collected (Table 1 header) but not printed per row in the circulated PDF, so melanin as a covariate cannot be recomputed.
- Single laboratory, single winter, temperate latitude, end-of-winter scheduling. Generalizability to equatorial skin, obese subjects (larger volume of distribution for 25(OH)D), or chronic kidney disease (impaired CYP27B1) is untested.
- Heaney-slope IU conversion is a linear local approximation around 10,000 IU/day oral D3. It is not a calibrated radiometric yield in joules per IU.
7. Conclusions
Recomputing the 2007 LC-MS/MS table with paired inference, SI units, status migration, and a two-compartment (on-lamp / off-lamp) split does not change the original qualitative conclusion. It makes that conclusion numerically tighter:
- Four supervised 35–55 s nUVB sessions raised mean 25(OH)D by 13.7 ng/mL (34.2 nmol/L; 95% CI 10.7–16.7 ng/mL) in ten winter-insufficient adults.
- The rise continued after exposure stopped. That delayed expression is the circulating biomarker of a cutaneous vitamin D3 store being 25-hydroxylated.
- Relative response was larger at lower baseline. Absolute response did not depend on age in this span.
- Expressed against the same oral slope the 2007 paper used, each session is approximately 14,800 IU of parent D3 — after correcting the original ng/mL unit error.
- A modern repeat should add intact PTH, 1,25(OH)2D3, 24,25(OH)2D3, free 25(OH)D, calcium/phosphate, and GC genotype. Those assays would convert this pilot from a single-reporter study into a full D3-axis expression panel. They cannot be imputed from the 2007 numbers.
Appendix A. Worked Heaney conversion
Heaney et al., Am J Clin Nutr 2003;77:204–210, high-dose arm (10,000 IU/day oral cholecalciferol): over the first 22 days, mean 25(OH)D rose from 26.2 to 51 ng/mL. Slope used in 2007 = (51 − 26.2) / 22 wait — the 2007 text states the high-dose group reached 128 nmol/L (51.2 ng/mL) and a slope of 2.32 ng/mL/day. Four days at that slope = 9.28 ng/mL per 40,000 IU oral, or 9.28 ng/mL per four days of 10,000 IU.
Implied total oral-equivalent = 13.7 / 9.28 × 40,000 IU = 59,052 IU.
Per session = 59,052 / 4 = 14,763 IU, rounded in 2007 to 14,700.
Uncertainty: SD of Δ = 4.16 ng/mL → 4.16 / 9.28 × 10,000 ≈ 4,483 IU per session, which is the original “± 4,500.” The arithmetic of 2007 is internally consistent once the unit is restored to IU.
Appendix B. Source file
Primary document: WAGNER ET AL 25OHD 2007.pdf, dated 18 December 2007, 8 pages. Tables 1 and 2 on page 8. All 25(OH)D entries in this reanalysis were read from that table and independently averaged; the published means and SDs reproduce to the reported one-decimal precision.
Reanalysis completed 4 September 2026. No new human subjects were enrolled. No stored biospecimens were accessed.