Skip to content

WORKING ANALYSIS  •  DISASTER EPIDEMIOLOGY  •  EXPOSURE SCIENCE  •  RISK COMMUNICATIONS

1986 – 2026    Forty years of hazard, exposure, and attention

More People, More Cameras, More Headlines

An extrapolative study of disaster perception versus reality, 1986–2026.

Working analysis in disaster epidemiology, exposure science, and risk communication
Horizon of comparison: mid-1980s to mid-2020s (~40 years)
Wagner, R., Shisumara, F., et al. · August 2026

+67%

World population

4.96B (1986) → 8.30B (2026)

−90%+

Disaster death rates

Century-scale decline (OWID/CRED)

−96%

Weather deaths, 2010s

vs. the 1920s in CRED’s decadal framing

Abstract

Public belief that lethal, property-destroying natural disasters have become dramatically more frequent is widespread. This study tests two candidate explanations against the observational record: (1) demographic exposure — more people and more capital standing in the path of hazards — and (2) informational exposure — smartphones and social media making every event globally visible.

Using EM-DAT/CRED, Our World in Data compilations, Munich Re NatCatSERVICE, IPCC AR6 extremes assessments, UN population estimates, and floodplain / coastal / WUI exposure studies, the analysis finds that the perceived surge is real as a media-driven psychological phenomenon, yet only partly real as a physical-hazard phenomenon, and largely inverted as a mortality phenomenon.

Reported event counts rose because recording systems, satellites, and citizen reporting improved. Absolute economic losses rose because wealth and settlement expanded into hazard zones.

Core Finding

Death rates from disasters fell by more than 90% over the last century and remain far below mid-20th-century levels despite a roughly 67% larger world population. Some climate-sensitive extremes have increased. Geophysical event rates have not. The dominant drivers of the feeling that “disasters are everywhere now” are population-in-the-path plus the availability heuristic created by ubiquitous cameras and algorithmic feeds— not a uniform four-decade explosion in the Earth’s hazard rate.

1. Question, Design, and Definition

Question: Is the contemporary impression of more deadly, more destructive natural disasters than ~40 years ago explained primarily by more humans occupying hazardous landscapes (“more people in the way”) and more instantaneous, emotionally amplified reporting (smartphones + social media), or by a genuine increase in the frequency of the underlying physical events?

Design: Extrapolative synthesis, separating and examining four layers that are routinely conflated:

  1. Hazard — the physical event: storm, quake, flood peak, fire weather.
  2. Exposure — people, houses, and GDP sitting where the hazard can hit them.
  3. Vulnerability — building codes, forecasts, evacuation, health systems.
  4. Observability — whether the event is recorded, filmed, and circulated.

Definition: A disaster in EM-DAT (The Internationational Disaster Database – https://www.emdat.be)  is not “nature happened.” It is an earth event intersecting society hard enough to overwhelm local capacity and enter the record. This definition is sensitive to population, demographics, and reporting technology.

2. More people, and more of them in harm's way

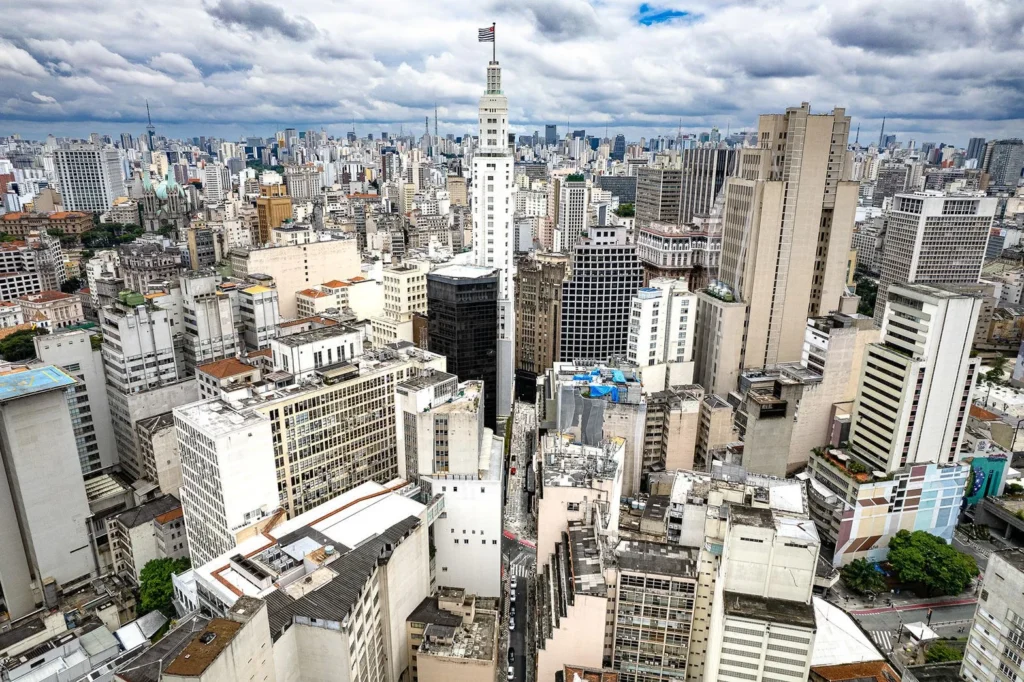
Figure 2. Capital and people packed into a hazard-adjacent urban footprint. Exposure, not just meteorology, turns weather into a recorded disaster.

World population rose from about 4.96 billion in 1986 to about 8.30 billion in mid-2026 — roughly a 67% increase. If hazard rates and settlement patterns were frozen, one would already expect more intersections of people with storms, floods, and fires simply because there are more people.

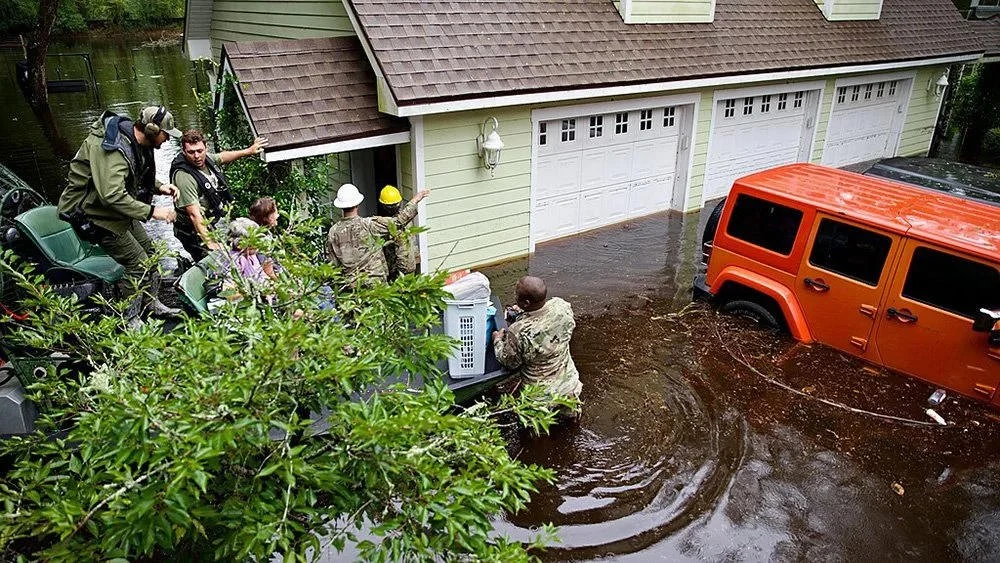
Settlement patterns were not frozen. They concentrated toward coasts, floodplains, and the wildland–urban interface. A flood that in 1986 crossed farmland or mangrove now more often crosses a subdivision, a logistics park, or a coastal megacity. The same physical hydrograph produces a “disaster” because assets and bodies occupy the water’s path.
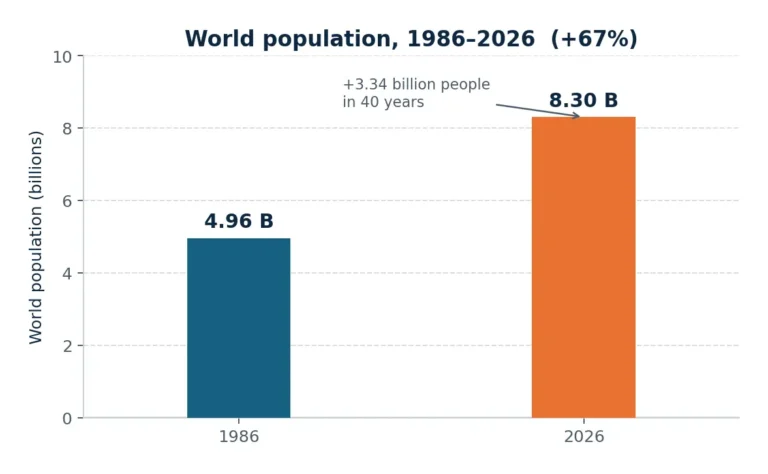
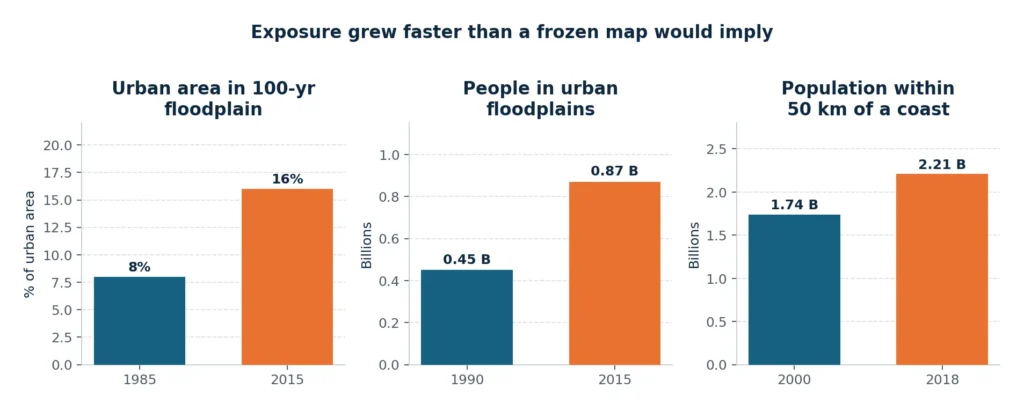
Figure 3. World population, 1986–2026. UN World Population Prospects medium-variant figures as stated in the working paper.

Three exposure facts anchor the argument

  • Floodplains. Urban area inside the 100-year floodplain nearly doubled between 1985 and 2015 (about 8% to 16% of urban area). Encroachment accelerated after 2000. People in urban floodplains rose from an estimated ~0.45 billion (1990) to ~0.87 billion (2015).
  • Coasts. Near-coastal population (within 50 km of shore) grew faster than inland population: ~1.74 billion in 2000 to ~2.21 billion in 2018 (+27% vs +23% globally). Roughly two billion people now live within 50 km of a coastline.
  • Wildland–urban interface. In the contiguous United States, homes in the WUI rose 47% from 1990 to 2020; the WUI now holds about 32% of U.S. housing on 9.4% of the land.
Figure 4. Exposure grew faster than a frozen settlement map would imply. Sources cited in §2 of the working paper.

The Key Asymmetry

Mortality and economic loss need not move together. Better forecasts and codes save lives while more expensive buildings raise the dollar tally of the same storm. Cameras then film the expensive objects burning or floating.

Figure 5. The same hydrograph can be a farm-field inconvenience in 1986 and a televised disaster once a subdivision occupies the water’s path.

Implication.  This is the core of the “more people in the way” thesis, and it is empirically strong. A second implication is asymmetric: mortality and economic loss need not move together. Better forecasts and codes save lives while more expensive buildings raise the dollar tally of the same storm. Cameras then film the expensive objects burning or floating.

The U.S. WUI makes the exposure mechanism visible at household scale. Nearly a third of American housing now sits on the 9.4% of land where houses and flammable wildland intermix. Housing growth there (+47% from 1990 to 2020) is a land-use choice, not a change in the planet’s background fire-weather oscillator alone.
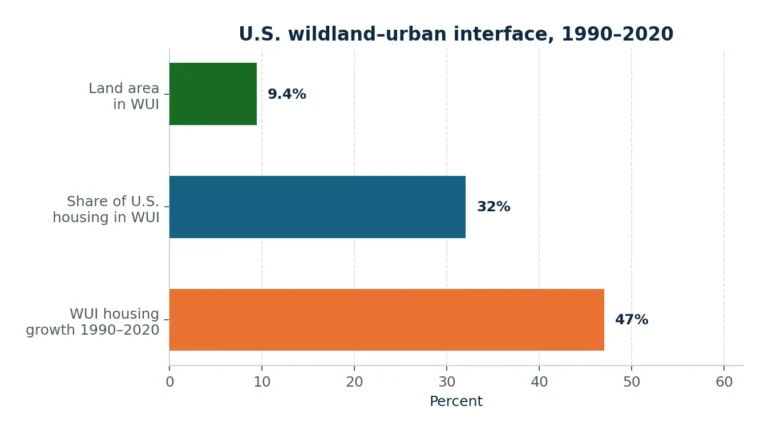
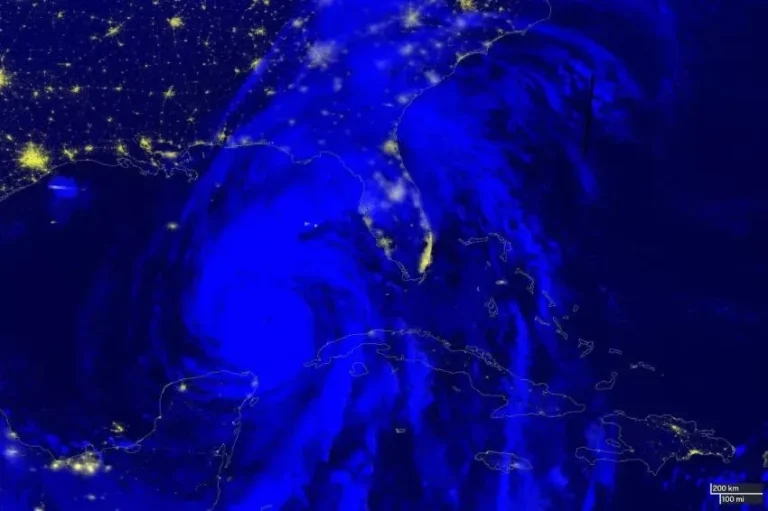
Figure 7. U.S. wildland–urban interface facts used in the text. USDA Forest Service / Radeloff and collaborators.

3. Databases filled in as cameras proliferated

EM-DAT, the standard global catalog, was institutionalized in 1988 after CRED’s work in the 1970s. The steep climb in reported disasters from the 1970s into the 1990s coincides with database construction, satellite weather, 24-hour news, and later the mobile internet — not with a proven step-change in global geophysics.

Our World in Data and CRED themselves treat much of the long rise in event counts as improved completeness, especially for smaller hydrological and meteorological events. Independent statistical work on EM-DAT finds that, after accounting for reporting bias, the long-term true number of many disaster types is more stable than raw counts suggest, with a temporary upward shift in hydro-meteorological reports in the 1980s–1990s and a later decline in the largest fatality events as mitigation improved.

The 911-system analogy

More recorded incidents can mean better detection, not a crime wave. Catalog growth is not, by itself, proof that the Earth became more violent.

4. Smartphones as a planetary sensor network

Around 1986, a flood in a provincial river basin might appear as a wire-service paragraph days later. In 2026, a flash flood is a vertical video on a billion phones within minutes. Observability approached one: the fraction of real events that become globally felt events collapsed the old filter in which only mega-disasters reached distant audiences.

Figure 8. Hazard plus settlement plus sensors. Night-lights under a storm track (NASA Applied Sciences, Hurricane Helene, 2024) is the physical counterpart of the phone in every pocket.

Mechanisms documented in the communication literature

  • Availability heuristic. Events that are vivid and recent feel common. Algorithmic feeds optimize for engagement; disaster footage is high-arousal content and therefore over-sampled relative to its base rate.
  • Citizen sensors. Smartphones turned bystanders into first reporters. That improves situational awareness and also injects unverified images, recycled clips from older disasters, and — recently — synthetic video into the same stream.
  • Skewed salience. Cross-border coverage tracks deaths and social/genetic proximity more than climatological importance. Earthquakes and wildfires can outcompete slow droughts for attention even when the latter kill more over time.
  • Compound rumor amplification. When two crises overlap, rumor peaks higher than for a single hazard.

The result is not that journalists invented disasters. It is that perception can rise even if hazard frequency is flat, because recording (R) and amplification (A) exploded after mobile broadband (~2007) and especially after 2012–2016 platform scale.

5. What actually changed in the hazards?

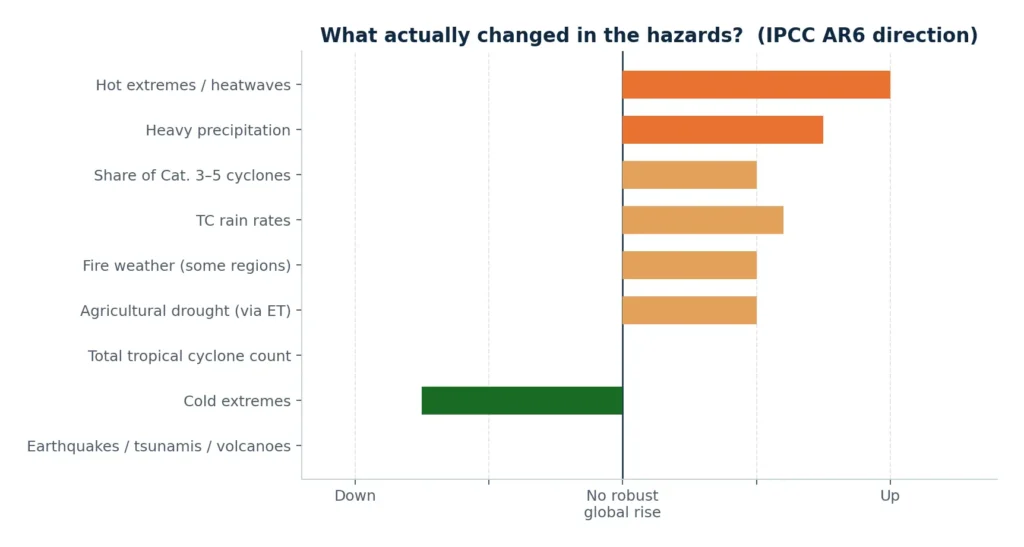
IPCC AR6 does not say “all disasters increased.” It is specific. Geophysical disasters are not more frequent. Some hydrometeorological extremes are more intense or more common. That is a real physical signal, concentrated in heat, moisture extremes, and the upper tail of storms — not a uniform multiplication of natural disasters.

Hazard classObserved change since mid-20th century / last ~4 decadesAttribution confidence
Hot extremes / heatwavesFrequency and intensity increased on most landVirtually certain; human influence main driver
Cold extremesDecreasedVery high
Heavy precipitationIncreased over a majority of well-observed landLikely; human influence likely in many regions
Agricultural / ecological droughtIncreased on a predominant fraction of land (via ET)Medium
Tropical cyclone countNo robust global increase in total storms—
Share of Cat. 3–5 cyclones / rapid intensificationLikely increased over ~4 decadesMedium
TC rain ratesIncreasedMedium–high
Fire weather (some regions)More probableMedium, regional
Earthquakes, tsunamis, volcanoesNo climate-driven frequency trendPhysical expectation: none
Compound heat + droughtMore frequentHigh
Figure 9. Direction of change, not a claim of uniform multiplication. Heat and moisture extremes moved; geophysics did not; total cyclone counts have no robust global rise.

6. Deaths and dollars — the two ledgers disagree

Mortality: the world got safer, not deadlier

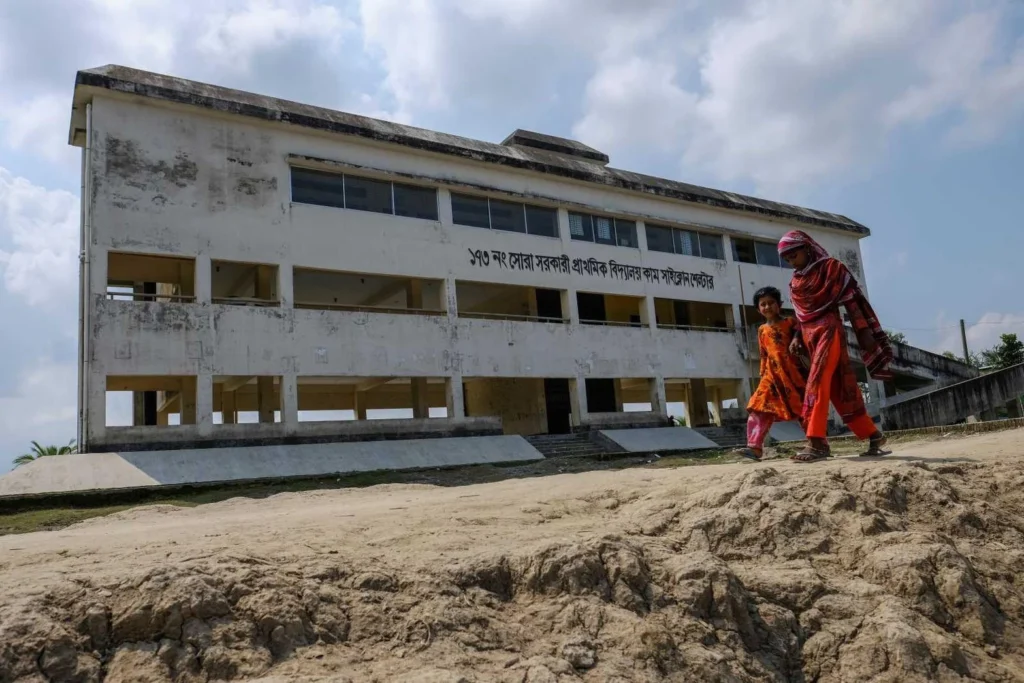
Figure 10. Vulnerability collapse made visible: a multipurpose school-shelter on raised ground in Bangladesh. Cyclone Bhola (1970) killed ~300,000 compared to later storms that killed tens to low hundreds.

Death rates from natural disasters fell by more than 90% across the 20th century. Even absolute deaths fell while population quadrupled over a longer horizon. In most recent years EM-DAT tallies on the order of 10,000–20,000 disaster deaths globally (temperature deaths incompletely counted), versus mid-century decades that commonly ran to tens or hundreds of thousands, and early-century peaks in the hundreds of thousands to millions when drought-famine and unprotected storm surges dominated.

Weather-related disaster mortality in the 2010s was on the order of 96% lower than the 1920s in CRED’s decadal framing. A 2025 analysis of ~2,000 deadliest climate-hazard events since 1988 estimates that development-driven reductions in vulnerability in Asia saved on the order of 350,000 lives (95% CI ~220,000–560,000) from floods and storms. An apparent rise in deadly African floods becomes non-significant when the death threshold is scaled to Africa’s population growth — again, “more people in the way,” not necessarily more lethal storms per capita.

Per capita, people are far less likely to die in a natural disaster in 2026 than in 1986. The opposite impression is a media artifact layered on residual mega-events (Haiti 2010, Indian Ocean 2004, occasional heat disasters) that still spike the annual series.
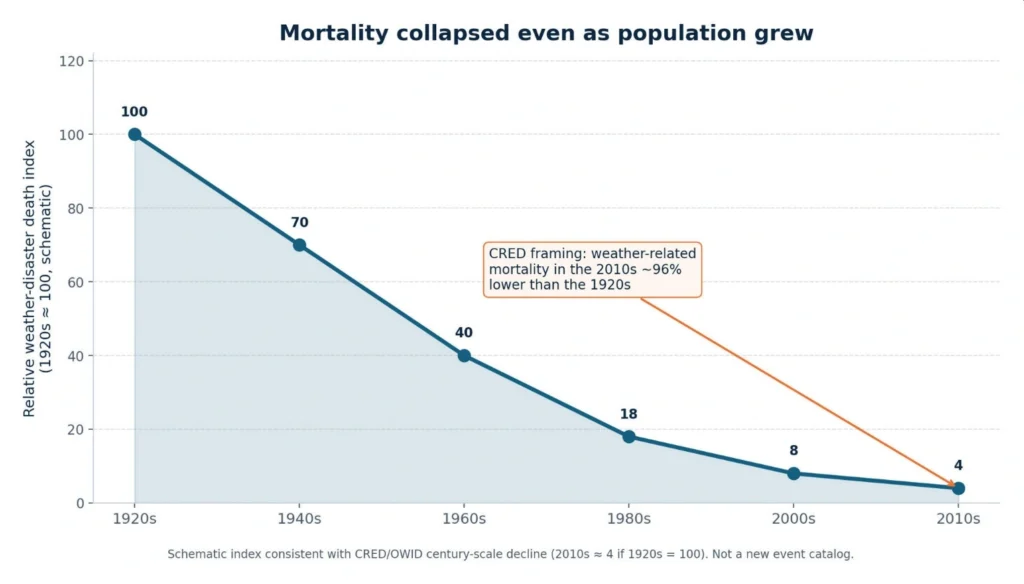
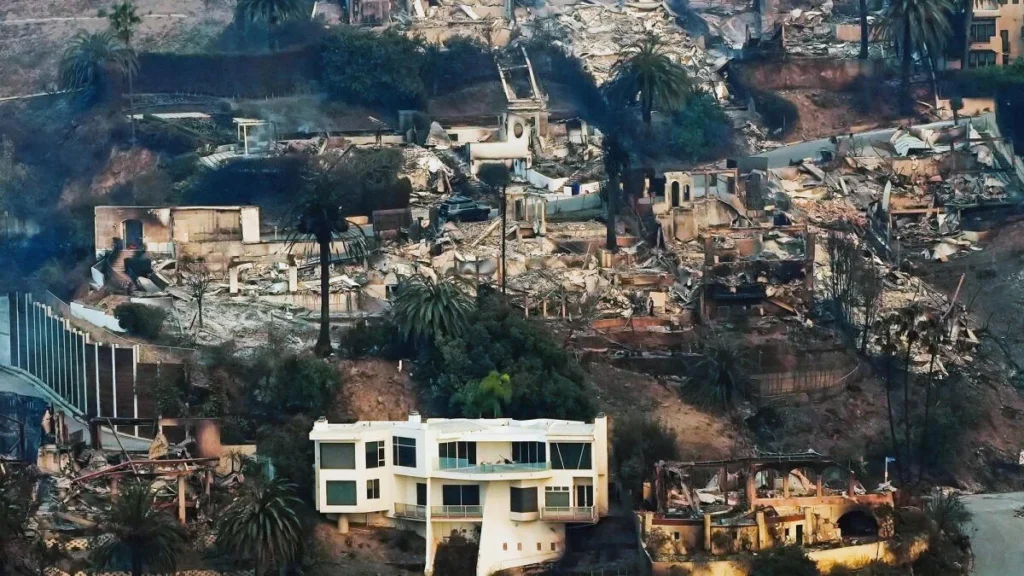
Figure 11. Schematic death-index consistent with CRED/OWID century-scale decline (2010s weather mortality ~96% below the 1920s). Not a new event catalog.

Economic loss: more wealth in the blast radius

Fig. 11 – Palos Verdes, Los Angeles fires, 2025

Inflation-adjusted global losses since 1980 are enormous (Munich Re: on the order of US$7.4 trillion through the mid-2020s). Secondary perils — severe convective storms, flood, wildfire — drive much of the upward slope in nominal and inflation-adjusted losses. Munich Re attributes the largest share of the increase to rising values exposed, while arguing a growing climate contribution for some of those secondary perils.

Normalization changes the story. Weather-disaster losses as a share of global GDP since 1990 have been roughly flat to slightly down (on the order of ~0.25% toward ~0.20% in updates through 2023–24). That is what one expects if economies grow faster than damage in many years. National pictures differ: several large industrial economies show weather losses rising as a share of GNI versus the 1980s, with the United States a clear example.
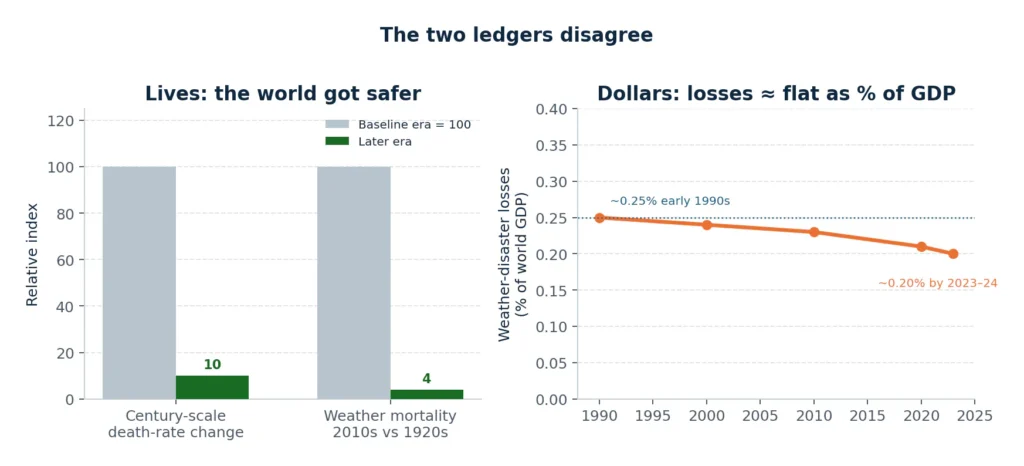
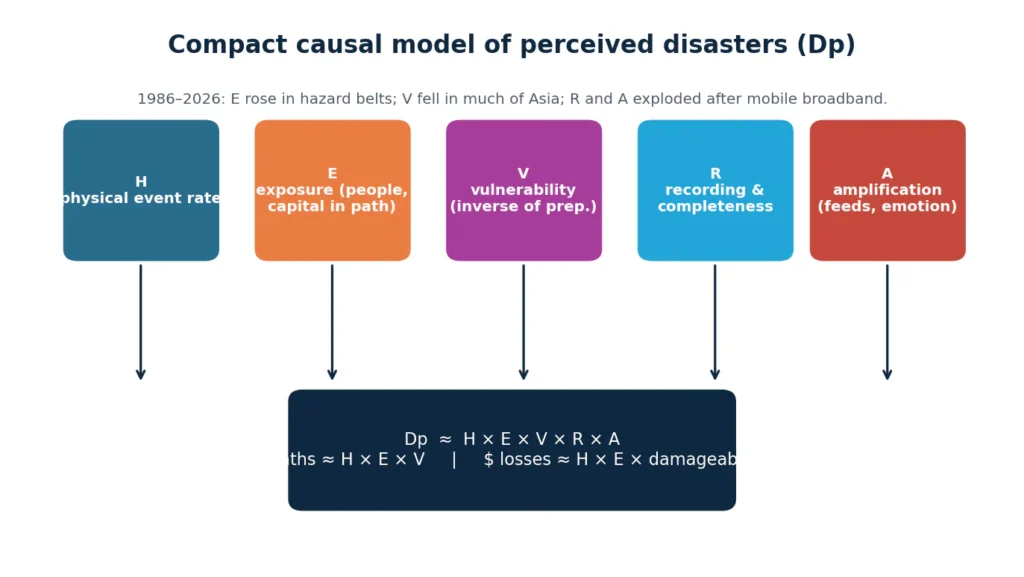
Figure 12. Read the two ledgers together: we save more lives and put more expensive objects in the same valleys and coastlines. GDP-share path follows Pielke Jr. Sendai-style normalization cited in the text.

How to read the ledgers

Absolute dollars up does not mean “the planet is killing more people.” It often means a richer world built more in harm’s way, then filmed the result.

7. A compact causal model

Let Dp = disasters perceived by a typical connected adult; H = physical event rate; E = exposed population and capital; V = vulnerability (inverse of preparedness); R = recording/reporting completeness; A = amplification (virality, emotion, algorithmic reach).

Dp ≈ H × E × V × R × A
deaths ≈ H × E × V    |    dollar losses ≈ H × E × damageability
Figure 13. Most of the rise in perceived disasters is E × R × A. A minority share is H for a subset of climate-linked perils. Almost none of the mortality narrative survives contact with the death-rate series.

From 1986 to 2026:

  • E rose faster than global population in key hazard belts.
  • V fell sharply for storms, floods, and famine-linked drought in much of Asia.
  • R and A exploded after mobile broadband and especially after 2012–2016 platform scale.
  • H is mixed: flat for geophysics; up for heat and many moisture extremes; mixed for total cyclone counts.

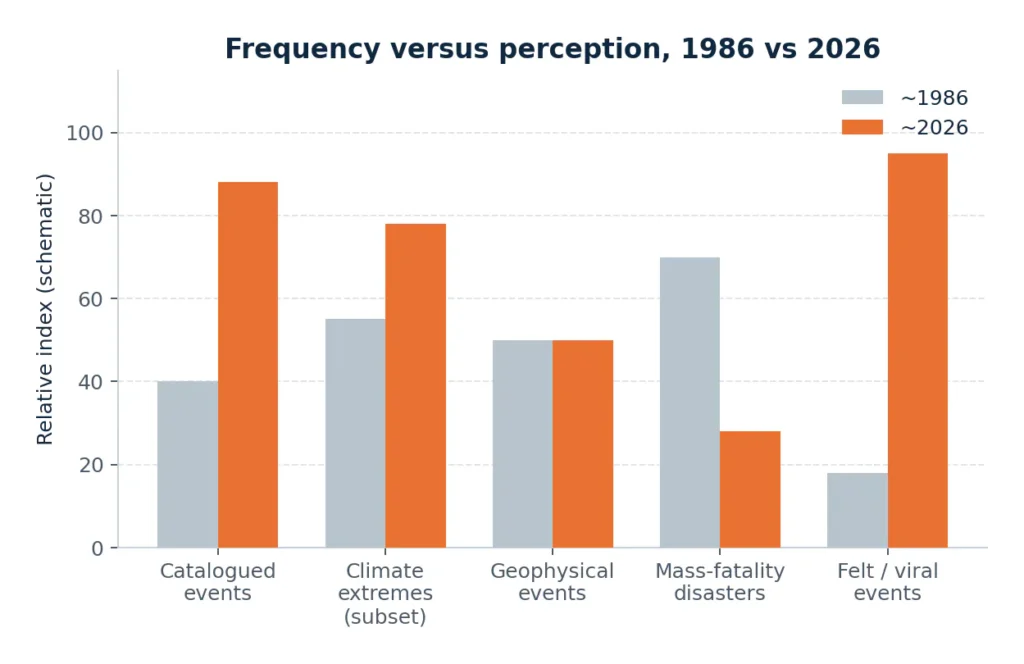
8. Summary of frequency versus perception

Figure 14. Schematic comparison of what rose and what did not. Catalogued and felt events rose; mass-fatality weather disasters fell; geophysics is flat.

Has disaster frequency actually increased?

  • As catalogued events: yes, in raw EM-DAT counts — substantially an artifact of better detection of small and medium events plus a real increase in some weather extremes.
  • As geophysical events: no.
  • As climate extremes: yes, for heatwaves, heavy rain, the intense-cyclone fraction, and fire weather in several regions; not established for every flood or every drought everywhere.
  • As mass-fatality disasters: no. Large-fatality weather disasters became rarer as warnings and infrastructure improved, even where exposure grew.

Is the public impression “merely” perception?

Not completely. Exposure growth is physical, and some extremes have intensified. Dollar losses in harm’s-way cities are real.

But the shape of public belief – “the planet is producing disasters at a historically unprecedented rate that now routinely kills and ruins on a scale unknown 40 years ago” – is a perception induced by the two mechanisms named in the brief, plus incomplete reading of loss data.

The argument in two forces

  • Exposure: More people and far more capital occupy coasts, floodplains, and fire-prone interfaces. The same storm now “counts.”
  • Observability: Smartphones and social media converted local events into global spectacles. Availability and emotion inflate subjective frequency.

Cites and references

Numbering follows the working draft. Sources are grouped by theme.

Mortality, catalogs, and reporting bias

  1. Our World in Data. The world has become more resilient to disasters — but investment is needed to save more lives. ourworldindata.org
  2. CRED / UCLouvain. EM-DAT: The International Disaster Database. emdat.be
  3. CRED. (2023). 2022 Disasters in Numbers. CRED report
  4. Jones, R. L., et al. (2022). Completeness of economic-damage fields in EM-DAT. Scientific Data.
  5. Joshi, J., Roberts, R., Tryggvason, A., et al. (2024). Long-term stability of true disaster counts after reporting-bias correction; decline in large-fatality weather disasters. Full text
  6. Geophysical Research Letters (2025). Deadliest climate-hazard events since 1988; Asian flood/storm vulnerability reduction. Paper
  7. Progressive Policy Institute. (2023). Natural disaster death rates fell by over 90% in the last century. Source

Economic losses

  1. Munich Re. Natural disaster risks — Rising trend in losses. Munich Re
  2. Munich Re / Grimm, T. (2025). Weather-disaster losses relative to GNI in large industrial economies. Munich Re
  3. Pielke Jr., R. (2024). Global Disaster Losses: 1990–2023. Source
  4. Pielke Jr., R. (2025). Climate Change is Showing its Claws. Source

Climate extremes

  1. IPCC. (2021). Climate Change 2021: The Physical Science Basis, WGI Chapter 11. IPCC
  2. IPCC AR6 WGI Technical Summary / Table TS.2. IPCC
  3. World Meteorological Organization. (2022). Regional trends in extreme events in the IPCC 2021 report. WMO

Population and exposure

  1. United Nations, DESA, Population Division. World Population Prospects 2024. Population figures as stated in the working paper.
  2. Andreadis, K. M., et al. (2022). Urbanizing the floodplain. Environmental Research Letters
  3. Tellman, B., et al. (2021). Satellite-observed flood extent and exposed population.
  4. Reimann, L., et al. Accelerating growth of human coastal populations. PMC
  5. Hauer, M. E., et al. U.S. low-elevation and floodplain population, 1990–2020. PMC
  6. Kulp, S. A., & Strauss, B. H. Related sea-level-rise exposure; Nature Communications. Nature
  7. USDA Forest Service / Radeloff and collaborators. Wildland–Urban Interface Growth in the U.S., 1990–2020. USDA Forest Service

Media, smartphones, and risk perception

  1. Kasperson, R. E., et al. (1988). The Social Amplification of Risk Framework (SARF). Jàmbá
  2. Social and Genetic Ties Drive Skewed Cross-Border Media Coverage of Disasters. arXiv
  3. The Impact of Misinformation on Social Media in the Context of Natural Disasters. PMC
  4. ScienceDirect (2022). Investigation of social media representation bias in disasters. ScienceDirect
  5. Mass Communicator. India citizen-journalism study. PDF
  6. Weng et al. Compound disaster-rumor amplification. PMC
  7. TikTok / Aceh flood representation study. Study PDF
  8. Inquirer / Nepal Check reporting on post-flood AI video and information vacuums (2026). Inquirer